
Today’s first (I hope) problem is the distribution of energy production among nine different sources, each with different supply characteristics, but all at the same price. The basic equations are straightforward:
Supply = Price Elasticity Of Supply * Price
Demand = Last Year’s Demand * Economic Growth * Last Year’s Price / This Year’s Price
Price = Price Coefficient * Demand / Supply
The problem lies in the fact that each energy source has a different Price Elasticity of Supply. For example, let’s consider the supply of coal as a function of price. Currently, it commands a price of $X per ton. Coal producers are delivering millions of tons of coal at that price. But suppose that the price were, for some strange reason, to drop to, say, $0.01 per ton. At that price, nobody could make any money, and the supply of coal would plummet to zero. Conversely, suppose that the price of coal were to increase to $X + $1.00. At that price, coal miners could afford to dig deeper, thereby reaching more coal. In other words, the higher the price, the larger the supply. Thus, the supply of coal as a function of price looks something like this:
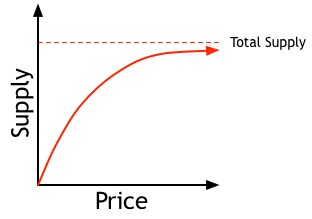
I use a straight line for the early part of this graph, but we cannot deny that coal is a finite resource: there’s only so much coal in the ground, and that’s the maximum amount we can dig out. Moreover, as we start to run out of coal, we’ll be digging really deep for smaller seams of coal, looking further and further for less and less. At some point, there just isn’t any more coal. That’s why this graph asymptotically approaches a maximum. This is the equation I use to represent this graph:
Supply = Total Supply - Typical Accessibility / Price
where the Total Supply is merely the total amount of coal in the ground, and Typical Accessibility is a measure of how easily the “typical” coal seam can be mined. This is really just a scaling factor that allows us to differentiate between these different situations:
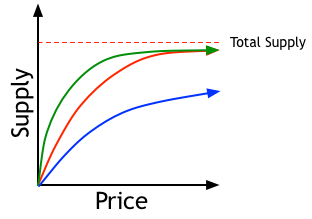
Here, the green curve reflects a high value of Typical Accessibility, and the blue curve demonstrates a low value of Typical Accessibility. This graph, however, represents the situation at the beginning of human history, before the first coal was taken out of the ground. The fact is, we have already take a great deal of coal out of the ground, so the supply curve today looks more like this:
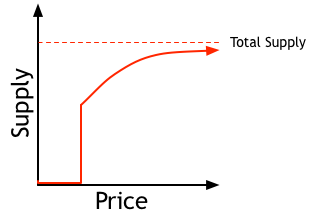
In other words, there’s no cheap coal left; we’ve already dug up the easy-to-reach coal and must now dig deeper and deeper for each additional ton of coal. The corrected equation is thus:
Supply = Total Supply - Cumulative Consumption - Typical Accessibility / Price
This basic formula applies to all nonrenewable resources such as coal, oil, natural gas, and nuclear, although each one has different values of the two controlling constants (Total Supply and Typical Accessibility).
But it gets even more complicated: renewable resources have no upper limit on total reserves; their upper limit is in annual production. In other words, we can continue to use wind power for centuries, but the supply of wind power is limited by the total amount of wind on the earths’ surface. Granted, that’s a lot of wind, but there’s still a point where the planet is so bedecked with windmills that there’s just no space left for any more. Thus, the controlling equation looks just like the equation for coal, except that Cumulative Consumption doesn’t apply here:
Supply = Total Supply - Typical Accessibility / Price
Here, Total Supply means the maximum amount of wind energy we could obtain if we blanketed the planet with windmills, and Typical Accessibility reflects the fact that some sites have lots of wind and so generate energy cheaply, whereas other sites don’t have much wind and so the electricity from those sites is more expensive.
The Killer Problem
But now we come to the real problem: once we’ve established the price, how do we figure the energy mix? That is, for a given price, how much coal, oil, natural gas, etc will we use? If I were smarter, I might be able to figure out an analytic solution (that is, derive one big mathematical formula that solves the whole problem), but I’m not that smart, so instead, I’ll have to cook up a numeric solution (a computer algorithm that figures it out). That algorithm will have to be incremental in nature (it will proceed in tiny steps from the starting point to the final point). The starting point is last year’s energy mix (the price of energy and how much of each type of energy is being used). It will then take a tiny step from the previous year’s price to this year’s price, and recalculate the energy mix. It will repeat this process lots of times until all those tiny steps add up to the big step from last year’s price to this year’s price.
We have to do it this way because the results for one energy source affect the results for the other sources. If we did it in one big step, then the first energy source we used (say, oil) would affect all the others, but none of them would affect oil. We need them all affecting each other, so we do the slightly inaccurate sequential approach in tiny steps so that we approximate them all affecting each other.
Unfortunately for me, my program structure does not permit an iterative solution like this. That’s because I cleverly arranged it so that all the information specific to each page is contained on that page. The basic processing will be carried out by a simple loop. The program takes each page in turn and reads its formula, which is stored as a string — in other words, just the letters that make up the equation. Then it “parses” that string: translates it into an actual formula that it can compute. Then it stores the result of that calculation back in the page. This is not how I handled it in the original version; in the original version, the formulas were all written in the program code, and the formula shown to the player was supposed to be the same as the one in the program code. This is bad form; in programming, a general rule is to have just one version of everything, so that if you change that one version, you don’t have to chase down all the other versions and correct them. With multiple versions, you always end up with bugs arising from failing to keep everything in perfect synch.
There is one way to carry out the iterative solution with the modern structure: run the complete set of cards many times before presenting the results to the player. The expectation is that the equations will all converge to the correct solution after enough iterations. This scares me, though, because there’s a nasty danger whenever you build a large set of coupled equations like this: the system can go hyperbolic on you. Suppose, for example, that I have two pages, each with its own formula. Page1 has the formula
1.01 * Page2
. But Page2’s formula is
1.01 * Page1
. Now, run these formulas in sequence a few times and you’ll see the two values exploding. You might think that this is easily prevented by not setting up two such formulas, but what if those two pages are far apart in the structure and obtain their results from each other only through many intermediate steps? Any environmental system has many feedback loops in it, and the equations should reflect that. In the real world, a variety of complex factors conspire to keep everything within reasonable bounds. But I can’t build in that kind of complexity.
Thus, I am faced with a choice between two unpalatable options. Option A is to retain the modular structure and run the system many times before presenting the final results to the player. That runs the risk of producing a hyperbolic system, which could prove immensely difficult to stabilize. Option B is to build all the equations into the code and use a proper convergent algorithm.
He flips the mental coin in his head. It soars upward, spinning over and over. Which way will it land?
2:45 PM
I’ve been writing this all through the day. I just got back from some outside work, during which I mulled over the problem. I’m leaning towards custom code, because I suspect that there will be more problems like this one. Besides, I figured out some ways to make the custom code approach more practical. However, another idea occurred to me: what if I build a custom function to handle convergent iterations? In other words, the formula for Energy Price might look like this:
Convergence( Energy Price, Oil, Coal, Natural Gas, Nuclear, Solar Photovoltaic, Solar Water, Hydro, Wind, Geothermal)
This would look like a black box to the player – but then, the whole idea of a convergent algorithm is pretty much a black box for almost everybody.
Another benefit of the custom code approach is that I am free to use any mathematical process I want internally, and I can present it to the player as a mathematical black box and explain its function without getting overly mathematical.
I am therefore going to spend the next few hours fleshing out exactly how the custom code approach would work, just to be sure before I make the decision.