
This last month has been long and tedious. I’m tuning the system, getting all the numbers to come out with believable values. This is tricky work; with some 80 interlinked variables, getting everything to balance out can be quite complicated. This is what I’m best at: keeping a complicated system in my head in a way that allows me to figure out why it is behaving as it does, and what must be done to correct undesirable behavior.
However, the problem of getting the energy systems tuned is proving to be particularly difficult. I have precise expectations for this. Here’s a recent page of output:
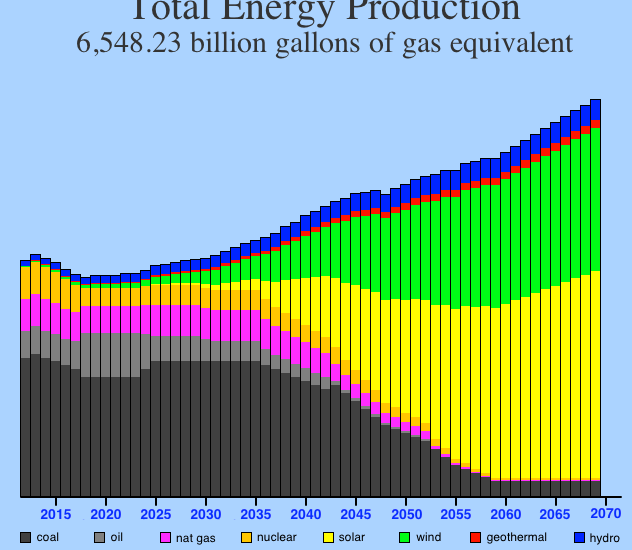
This is pretty good. Coal takes a little too long to drop off, and oil is both too small and too slow to drop off. Same for natural gas and nuclear. Solar is late getting started, but it does grow rapidly when it finally gets started. Wind is a bit better than solar, but needs some beefing up. Geothermal is still too weak, but hydro is just about right. So, using this graph I need only do some tweaking.
Sadly, it turned out to need more than tweaking. I have now gone through five different algorithms trying to find one that would fit my expectations. There was one algorithm using Gaussian curves to calculate supplies; it produced results that were too uniform. Then I tried a complicated geometrical algorithm that was supposed to blend the slopes of adjacent line segments to calculate a smooth curve; it had some nasty steps in it. I forget the others, but the one that seems to be working now uses cubic polynomials fit to the four points closest to the point whose value I’m calculating. That is giving me better results. Right now, it looks like hell, but I know that I can get it close to my desired results with some straightforward tweaking.