
I wrote the previous essay on a Monday. The next morning, while chatting with my wife Kathy, I expressed pessimism that anybody would actually build the thing. “It’s really a piece of cake, but people just can’t understand the underlying thinking. They’ll never do it” I groused.
“So why don’t you do it?” she challenged me.
“I’m not sure that I can write decent code any more.” I fudged.
“Why not try it and see? What do you have to lose? A week’s time?”
“I suppose…” So I went to work. I already had the verbs. The first thing I did was to draw a quick screen mockup. I already knew that it had so show different values on a single scale: the number of infections, the number of deaths, the total population, and the GDP. I couldn’t mix absolute GDP dollars with absolute Covid-19 infections or deaths. So I had to use a percentage scale, running everything relative to its original value before the pandemic began. Here was my quick idea for the display:
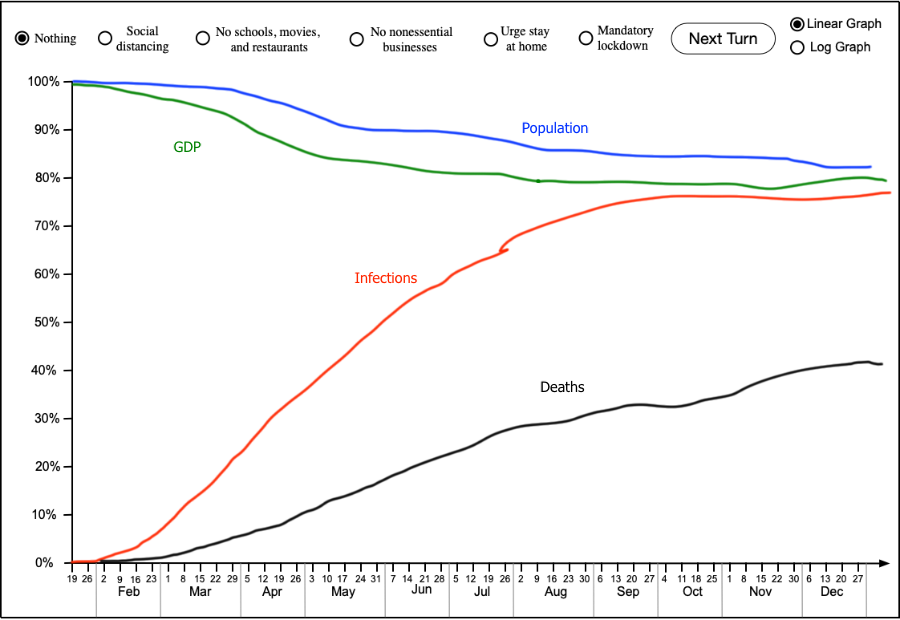
That immediately revealed a problem. In the real game, deaths would never go as high as my sketch, which shows something like 140 million deaths. They should come in around a few hundred thousand; but 300,000 deaths would comprise only 0.1% of the population, which would never rise above the bottom line. Even if you screwed up badly and got a million deaths, it would rise above the bottom line by only about two pixels. That’s unacceptable.
So I put the problem aside and worked on watering my seedlings out in the forest. I quickly realized that I would need a log scale, which is in fact what the professionals use:
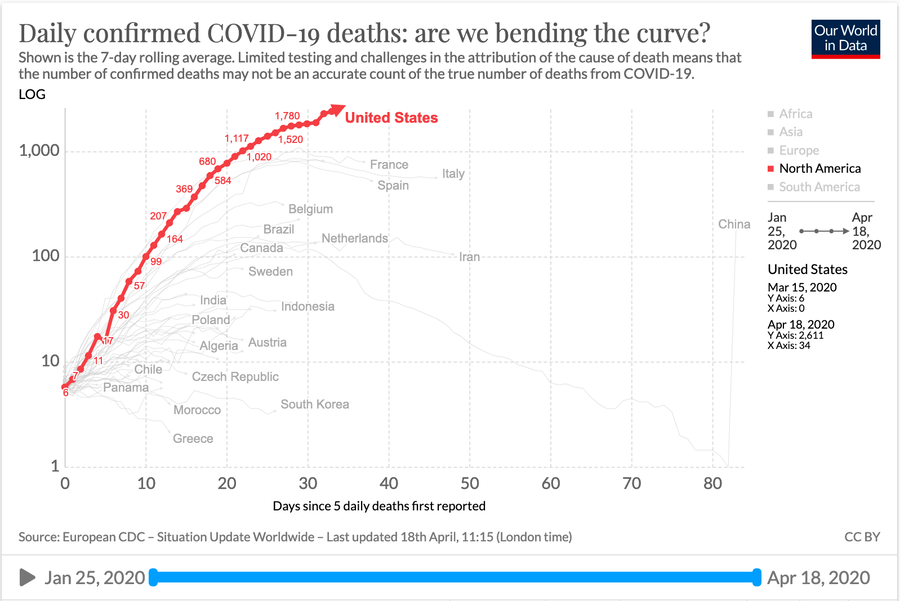
Note that the vertical scale is logarithmic; this makes it possible to show a huge range of differences without swamping the low-value cases.
But alas, my problem was even more difficult. Consider: I want to show deaths, which will be very low at first and won’t show up; that’s why I need a logarithmic scale. But if I use a logarithmic scale, then the changes at the top of the graph will be microscopic—that’s unacceptable. So I went to bed Tuesday night thinking that the project couldn’t be done.
Wednesday morning I woke up with the solution, and it’s a rather clever one, if I do say so myself {ahem!} I decided on a double-sided logarithmic graph:

Being the perpetual cynic, I couldn’t help but find an unhappy response to this innovation: “Hell, the kids would never have figured out something like this on their own. Your way of thinking will die with you.” Now, I realize that there are indeed plenty of brilliant designers who have cooked up ideas like this; I’m sure that this design is not new. The problem, from my point of view, is that the likelihood of a game designer possessing the design talent for something like this is low. Crap.
Ah, but what’s the algorithm for calculating y-values on this double-logarithmic scale? There are two separate algorithms that meet at 50%. Here’s how I figured out the calculation.
The basic form of the underlying equation is
y = a * log(b * x + 1) + c
All I have to do is fit this to the two ends of the scale. For the lower scale (from 0% to 50%), the bottom is at pixel coordinate y = 700, and the 50% mark is at pixel coordinate y = 400. So we have two equations in three unknowns:
700 = a * log (b * 0.0 + 1) + c
400 = a * log (b * 0.5 + 1) + c
But you can’t solve a system of two equations in three unknowns. The upper equation yields c = 700, but the lower equation remains unsolvable for a and b. This is not really an obstacle; it just means that there are many different combinations of a and b that will work, and I’m free to pick any pair of equations. I tried out a few such combinations by hand. I decided to zero in on the right value of b by trying three values: 1, 10, and 100. Plugging those values into the lower equation gave me three solutions for the value of a:
a = (400 - 700) / log( 1 * 0.5 +1) = -1703
a = (400 - 700) / log( 10 * 0.5 +1) = -386
a = (400 - 700) / log( 100 * 0.5 +1) = -176
So now I need to evaluate how these scales look. I slapped together some quick tables showing the scaling:
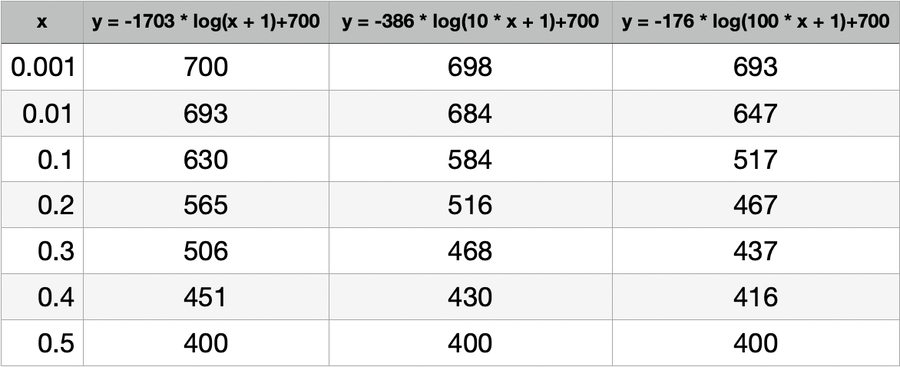
I suppose that I could have done this with a spreadsheet; it would have made it easier for me to experiment with lots of different combinations. But it was faster and easier to whip this out with a calculator. Here is what the scales look like:

Now, there’s no way to objectively decide which of these is the best, but I like the third scale, because it really shows small increases at the bottom end. I could have gone all the way to b = 1000, but that would have scrunched the top end (30% to 50%) together too much. So I have my values: a = -176, and b = 100. The upper half of the graph uses the same basic equations, only reversed for the top-down scaling.
The point of this exercise is to show you how to navigate through some simple math to deal with the design problem of getting a good scaling system for the graph.
Calculating the changes in values
The equations I sketched out on the previous page didn’t work, so I experimented with other schemes. Here’s how I analyzed the system.
We need to calculate the number of persons who are newly infected by the virus in any given week, which I’ll call nInfected.
nInfected = (nPopulation - nImmune) * pInfected
Here nPopulation is the number of people in the USA, and nImmune is the number of people who are immune by virtue of having already had the disease. pInfected is the probability that a single person will be infected in a week of daily life. We break this down as follows:
pInfected = (1 - (1 - pContagion)**(nEncounter * nInfected/nPopulation))
Here nEncounter is the number of people that the test subject encounters in a typical week. That in turn is set by the confinement policy set by the player:
nEncounter[0] = 100;
nEncounter[1] = 60;
nEncounter[2] = 40;
nEncounter[3] = 20;
nEncounter[4] = 10;
nEncounter[5] = 2;
The confinement policies associated with this array are:
0: no policy
1: 6 feet separation
2: no schools, movies, or restaurants
3. no nonessential businesses
4: urge stay at home
5: mandatory lockdown