
Deceleration
Today we tackle the interesting question of deceleration; the data I have to show about it is most perplexing. Here’s the basic science: when a meteoroid strikes the atmosphere, the friction causes it to heat up and emit light; the meteor is ripped apart into fine dust in less than a second. You might think that all that friction would slow down the meteoroid, but there’s a countervailing consideration: imagine the meteoroid as a ball of tiny particles. The air friction causes those tiny particles to be ripped off from the ball, and as they fall away, they incandesce, producing the light we see. The real situation is more complex, but this model demonstrates that the main meteor mass need not decelerate so long as the tiny particles are brought to a dead halt. In other words, the meteor itself never decelerates appreciably; instead, it sheds a stream of tiny particles, each of which decelerates sharply. The meteor never stops, it simply disappears as it loses its last particles.
As I said, this is a rather simplistic way of imagining what’s going on, but it does explain how it is that a meteor need not appear to decelerate as it travels through the atmosphere. As far as I know, there has been little or no data indicating that the main mass of a meteor decelerates during its passage through the atmosphere. However, since I have mountains of data, I thought that it might be interesting to at least examine the matter.
So I wrote some simple code that calculated the average deceleration at each point in the Leonids’ trajectories. For each and every Leonid in my sample, I have latitude, longitude, and altitude values for each and every flare. In other words, I know exactly where each flare was in 3D coordinates. By calculating the differences between these positions, I can calculate how fast the meteor moved. And by calculating the changes in velocity, I can arrive at the deceleration of the meteor.
Now, the deceleration values I obtain by this method will be really unreliable: after all, I’m measuring messy blobs of light, and so my calculations of positions, distances, velocities, and accelerations are necessarily full of error. But I have one factor on my side: sheer mass. Remember, there are 23,000 Leonids in my sample, which all together comprise 239,821 of the triplets required for these calculations. So I ran the data. I have now written up the results four times. Each time I came to the conclusion that there was nothing to report -- that the data were insufficient to support any hypothesis regarding deceleration. However, each time, there was something screwy about the results, some intermediate number that was either too big or too small. First it turned out that I had confused “alt” (the angular altitude of a flare) with “height” (the linear height of a flare). On another occasion, I had forgotten to convert from degrees to radians. I forget what the third stupid error was. But when I finally got all the goofs ironed out (I think), I came up with an astounding result: the mean deceleration of the Leonids in my dataset is -0.358 ±0.054 km/second**2. The first thing that’s astounding about this number is that it has such high precision. This number is six standard deviations from the null hypothesis value. In other words, we can be absolutely certain that these Leonids really were accelerating at something close to this value. But the second astounding thing about this value is that it’s negative deceleration: my data shows the Leonids speeding up as they enter the atmosphere, not slowing down.
Oops. I screwed up.
I have now gone over the code numerous times, and I still can’t see anything wrong with it. Here’s the code, in case you want to find the mistake. I am putting it up as a screenshot because my idiot website editor (RapidWeaver) refuses to permit me to post code in a neatly formatted structure. I’m sure that, deep in the secret innards of RapidWeaver, there’s a way to do it, but mere mortals are not trusted with such information:
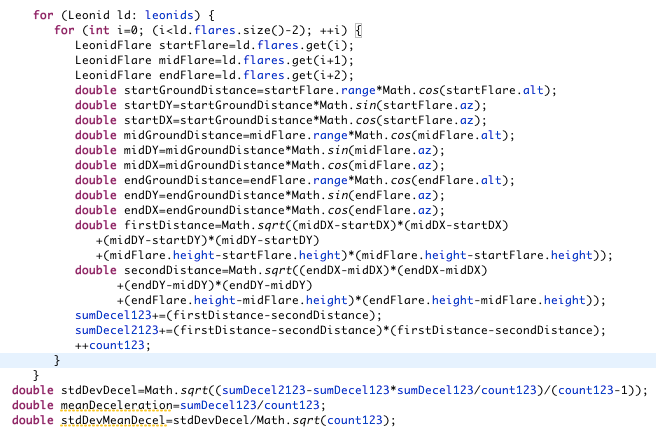
Please note that the mean deceleration is obtained by subtracting the second distance from the first distance. In other words, if the Leonid decelerates, then the second distance will be less than the first distance, and the value of sumDecel will be positive. However, the sumDecel comes out negative, so the mean deceleration is negative: the Leonid is speeding up as it traverses the atmosphere. Oops.
But I had another trick up my sleeve. The above approach treats every single triplet of flares as an independent unit; it just throws them all into one big basket. Another approach is to consider the decelerations meteor by meteor rather than flare by flare. So I wrote up some code that applies a linear regression to the flares in a single Leonid. The slope of the line of velocities is the acceleration. I compiled a histogram of those slopes and got this result:
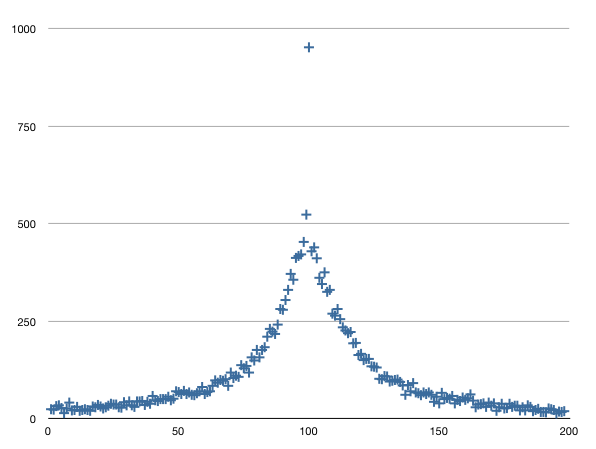
Most of what this shows is simply noise. The distribution is almost centered on zero acceleration -- almost. The median is at about -2.2 km/second**2. At least this value is in the right direction: negative. This histogram definitely shows deceleration, and at a believable value to boot!
So, what does it mean? I really don’t know. I am quite certain that the Leonids are not accelerating as they traverse the atmosphere. I’d be willing to accept the the median value of -2.2 km/second**2 as a reasonable value. The most defensible number, statistically, is the value of +0.358 ±0.054 km/second**2 -- but that number is simply ludicrous physically. My guess is that the problem arises from some error on my part, that in fact I have somehow reversed the sign of the acceleration, and that the Leonids really are decelerating at this tiny rate. But I cannot explain how that might have happened.