
Temporal-Spatial Randomness
I began watching meteors in August of 1966, when I observed the Perseid meteor shower. I was hooked, and began spending a lot of time watching meteors. It seemed as if the meteors came in bunches; they certainly did not come randomly -- that was my impression. But testing for temporal nonrandomness is difficult. I tried all sorts of things over the years: an attempt to get precise measurements in my senior year in college, another attempt in 2001, and of course the 1999 Leonid outburst. I have already explained the basic science behind my thinking. But now, having obtained a huge dataset of Leonids, I can really go to work on the problem.
My first attempt involved looking at Leonids spatially. I compiled a list of the times and locations (latitude and longitude) of every Leonid in the dataset. Then I performed a relative spatial analysis: for each and every Leonid, I noted the positions of all Leonids falling within the next 3 seconds relative to that Leonid. Here’s the graph I got from that work:
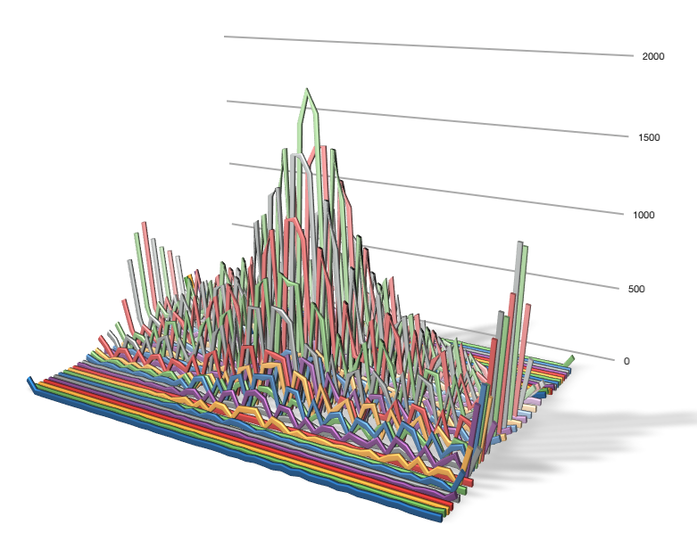
This shows what appears to be a simple 2D gaussian peak centered on zero. In other words, most Leonids appeared very close to the previous Leonid. But how close would they appear if they were distributed randomly? Because of the narrow fields of view of the cameras, simple selection effects acted in favor of a strong clumping toward the center. Moreover, the cameras were not synchronized precisely; a few seconds off could easily ruin any such analysis. I wasn’t surprised by any of this; I just wanted to begin my analysis with a simple visualization of the data. What killed my effort was my realization that the resolution that I saved latitudes and longitudes, 0.01 radians, corresponded to about 50 km of linear distance. The best data would come from Leonids closer than 50 km to each other -- and I had thrown away that data. Oh well. It is possible to recover that information from the data, but at this point I’m not eager to do that job.
So I moved on to a different analytical approach. Everybody has always concentrated on temporal factors, because we get good timing data but lousy positional data. However, I have excellent positional data (at least within the data for a single camera), so I can do an analysis based on position. This led me to a quick experiment with compelling results.
For all the Leonids in a single camera’s dataset, I ran the following test: I looked up each Leonid that came after the Leonid in question. I calculated its angular distance from the original Leonid. I then added that angular distance to an accumulating sum of distances, and the square of that distance to an accumulating sum of squares of distances. If and only if the Leonid fell within 3.3 seconds of the original Leonid, I also added its angular distance to a different accumulating sum of distances, and the square of its angular distance to a different accumulating sum of the squares of distances.
When I was finished with all the Leonids in the camera’s dataset, I had six numbers:
The sum of the angular distances of all Leonid pairs, which I will call ∑X.
The sum of the squares of the angular distances of all Leonid pairs, which I shall call ∑X².
The sum of the angular distances of those Leonid pairs separated by less than 3.3 seconds, which I shall call ∑x.
The sum of the squares of the angular distances of those Leonid pairs separated by less than 3.3 seconds, which I shall call ∑x²
The number of all Leonid pairs, which I shall call N
The number of Leonid pairs separated by less than 3.3 seconds, which I shall call n.
It is possible to combine these numbers to calculate mean values, standard deviations of the means, and best of all, the standard deviations of the difference between the means. Here are the final results:
x bar | σ | n | X bar | σ | N | X bar - x bar | σ | |
| AL50F | 14.90 | 0.0955 | 6117 | 18.14 | 0.0038 | 6154786 | 3.235 | 0.095 |
| AL50R | 2,301 | 0.3103 | 13184 | 24.81 | 0.0094 | 13130250 | 1.799 | 0.3104 |
| AR50F | 11.81 | 0.0694 | 7575 | 17.79 | 0.0035 | 7591356 | 5.970 | 0.0695 |
| AR50R | 16.23 | 0.0780 | 12038 | 19.18 | 0.0030 | 12377800 | 2.954 | 0.0781 |
| FL50F | 14.84 | 0.0756 | 10543 | 17.08 | 0.0034 | 6857956 | 2.240 | 0.0757 |
| FL50R | 17.11 | 0.0665 | 18503 | 18.28 | 0.0025 | 15576571 | 1.173 | 0.0665 |
First, you will note that x bar (the mean value of x) is always smaller than X bar (the mean value of X). In other words, the Leonid pairs that were separated by less than 3.3 seconds tended to be closer together than just any old pair. Bingo! Non-randomness! If pairs that are close in time are ALSO close in space, then they must be physically related.
However, these numbers by themselves do not constitute statistical evidence; in order to verify that the differences are statistically significant, we have to test the hypothesis that the difference between the two mean values is equal to zero. Obviously, it’s not equal to zero, but we have to test the possibility that it could be zero. The mean difference between the two distributions is presented on the penultimate rightmost column. The sample standard deviation of the distribution of the difference is presented in the rightmost column. To test the null hypothesis (namely, that the two means are statistically indistinguishable), we need merely divide the difference of the two means by the sample standard deviation. For example, the first row has X bar - x bar = 3.235, with σ = 0.095, so the division yields a dividend of 34.05. Statisticians will read this as saying that the testing value is 34 standard deviations off the mean. Now, statistical significance is quickly estimated as follows: if you’re less than 2 standard deviations off the mean, then you got nothin’. If you’re between 2 and 3 standard deviations off the mean, you probably have something, but you need to check everything carefully. If you’re more than 3 standard deviations off the mean, then unless there’s something really crazy about your data, you’ve definitely got a statistically significant result. We’re 34 standard deviations off the mean!
In all truth, I’m a bit suspicious of this result -- it’s too good. I feel like the guy in the old western who says, “Yes, it’s quiet -- too quiet!” just before the bad guys jump out from behind the bushes. I know that there are bad guys out there. It’s hard to believe that something this blatant could have escaped notice before now. On the other hand, nobody has ever had 27,000 meteors to work with.