
I self-published the first version of Balance of the Planet in 1990. It was quite advanced for the time, but I was never satisfied with it. In 2012 (if memory serves), I decided to build a new and better version in Java. I spent about 16 months working on the project, completing it in the fall of 2013. I then announced it to the world as a free download. Of course, not many people had Java installed on their computers, and I made no effort to publicize it. I had hoped that perhaps some organization might decide to popularize it. Nothing came of it. I’m sure that, had I been a more aggressive salesman, I could have found a nice home for the software. But I hate selling myself, so the whole thing quietly died.
Especially confusing is the fact that the original design was meant to operate on a server. That is, the Java code would reside on a server and would create web pages that it would present to the user at each step. I did not know how to make this work, but a friend volunteered to handle the client-server code. He worked manfully on it, but never did get it quite working properly.
You can download it here:
http://www.erasmatazz.com/library/software/index.html
Sadly, the source code won’t even compile any more. It was written in an older version of Java and apparently it can no longer function in the new Java environment. I’m sure that I could get it running if I knew about the different Java versions and how to handle this problem, but I have too many other fish to fry, so I let it go.
Fortunately, none of this poses a serious obstacle, because the code must be converted to JavaScript anyway, and so the details of the Java display code are of no significance to us. You can’t simply cut and paste my source code into JavaScript. Instead, you’ll have to build a completely new JavaScript program from scratch, using my code as a detailed guide.
The easiest translations will be the numerical calculations; those will be fairly straighforward, although still not as simple as cutting and pasting. Next easiest will be the variable declarations and datasets. Some of the data is in XML format, but there are online tools that will convert XML to a JavaScript object.
The biggest problem will be converting the Java Swing code to JavaScript code. Java Swing is a conceptual mess; you do NOT want to try to understand it, if you wish to retain your sanity. I will walk you through the layouts and perhaps provide you with formal drawings. Especially difficult might be my custom “multiscrollbars”. Or possibly the history displays with their lengthy bar graphs — see the screen displays below.
Here is a representative sample of the screen displays. They are all static except for user input controls.
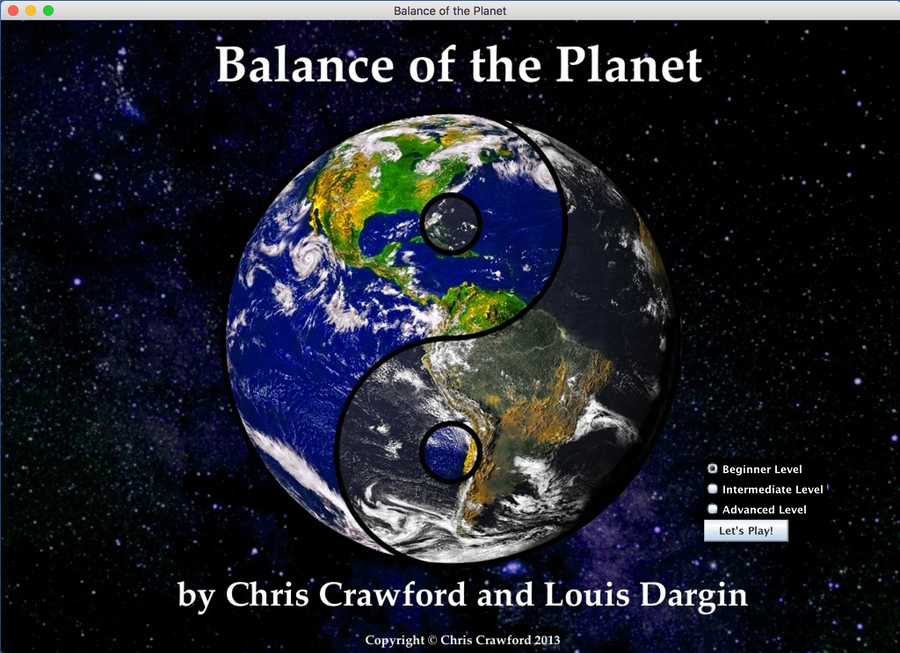
Introductory Splash Screen
The player chooses the level of play here
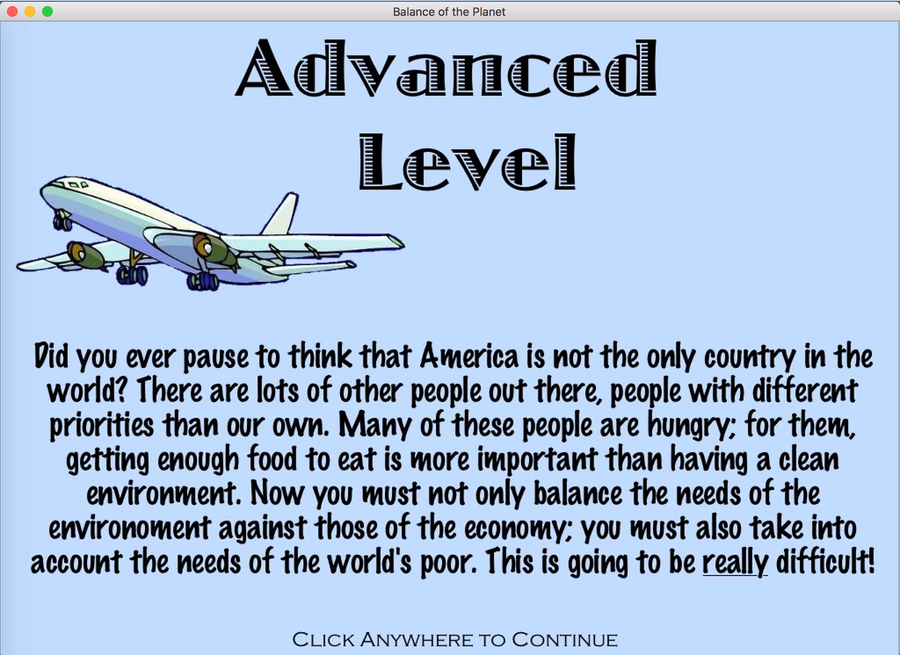
This is the description of the highest level
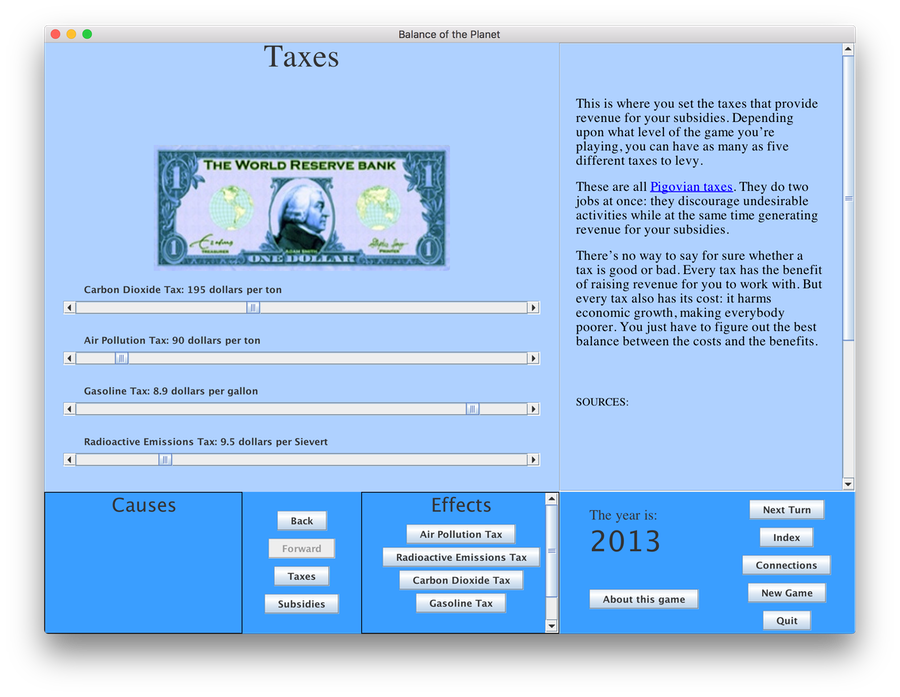
The first page the player sees after the level description.
This allows the player to set the four taxes that are the main control for the game.
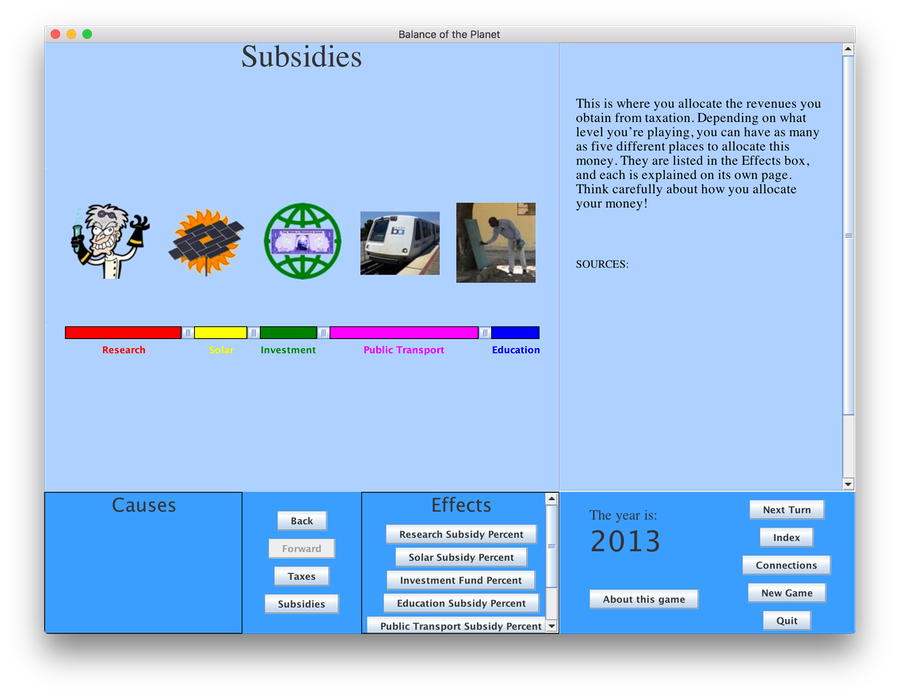
This page is where the player spends the revenues raised by the taxes.
Note the “MultiScrollBar” device that allows the player to allocate 100% of the revenue without worrying about how the numbers add up. This might prove difficult to reproduce in JavaScript.
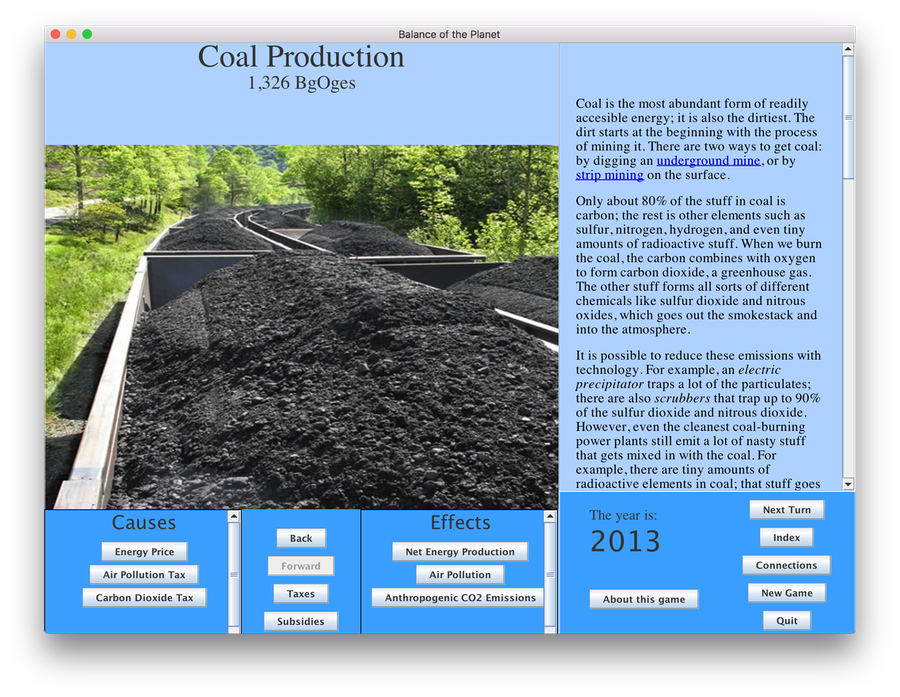
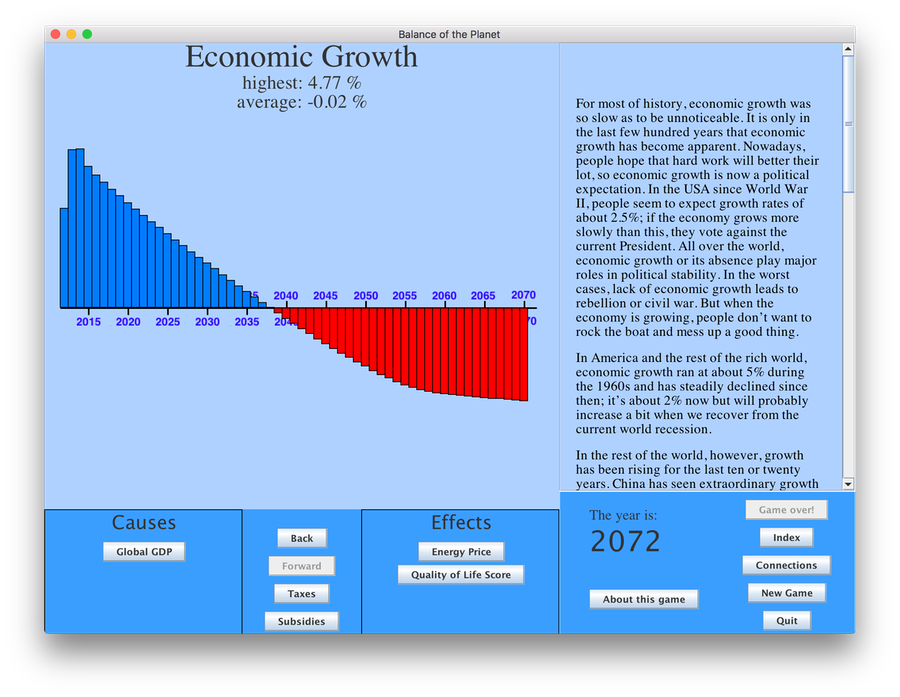
A typical factor page. The text on the right explains the topic. This text can be quite lengthy, hence the scroll bar on the right. It also includes links to citations for additional information for the player. Note also the “Causes” and “Effects” lists. These are the factors that control this value (Causes), and the factors that this factor controls (Effects). The end result is a big web of causal relationships. Note also the underlined hyperlinks in the text on the right. These lead to “backgrounder” pages that explain some of the ideas behind the simulation. Here are the two linked backgrounders:
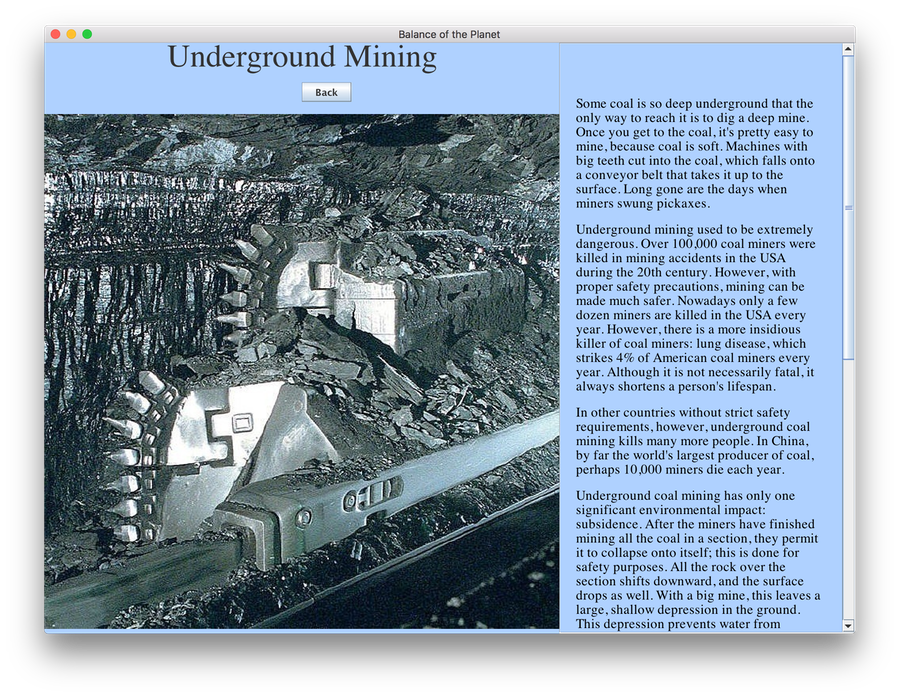
As you can see, this includes a lot of text. There are 90 such backgrounder pages.
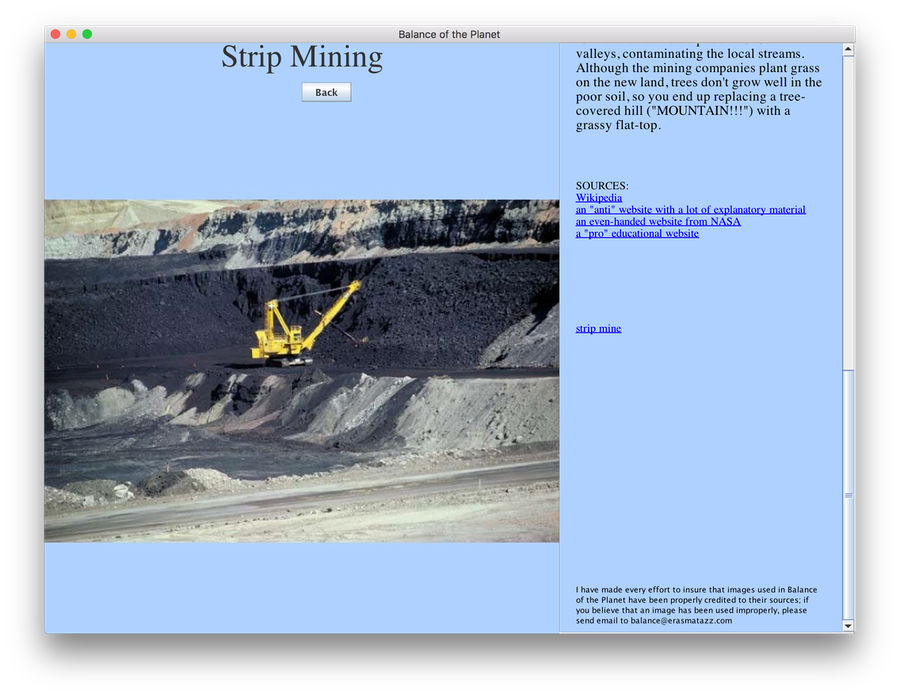
This is the other backgrounder, but I’ve scrolled down to the end of the text. Notice the links to Wikipedia and three other websites: a “pro” website, an “anti” website, and a “neutral” website.
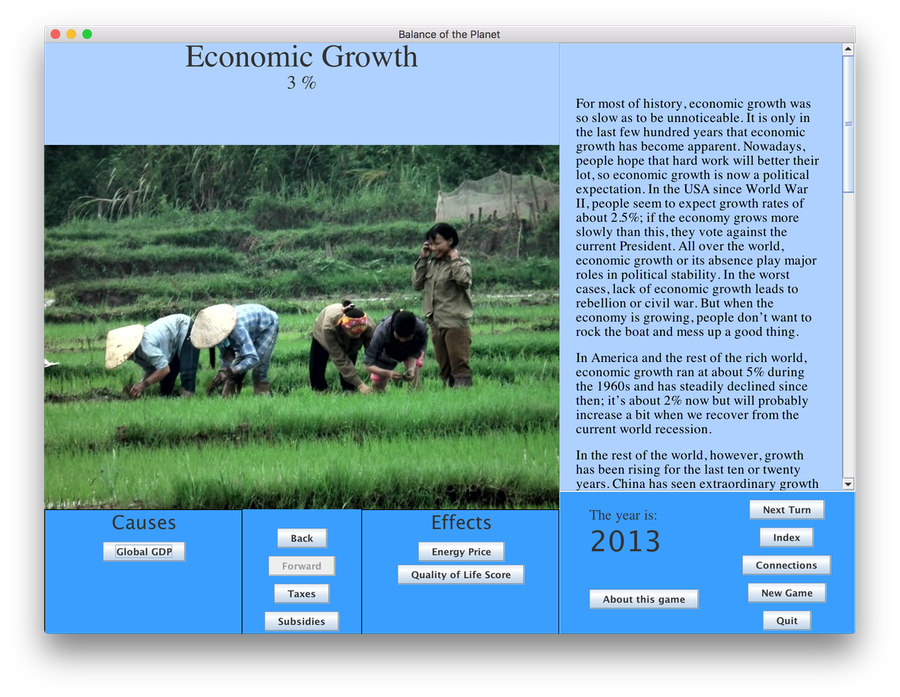
Here’s another factor page. There are 86 such factor pages.
The game is only one turn long. When the user clicks on the “Next Turn” button (which has been renamed to “Run”), the simulation runs for 60 years and then produces the results on a page like this:
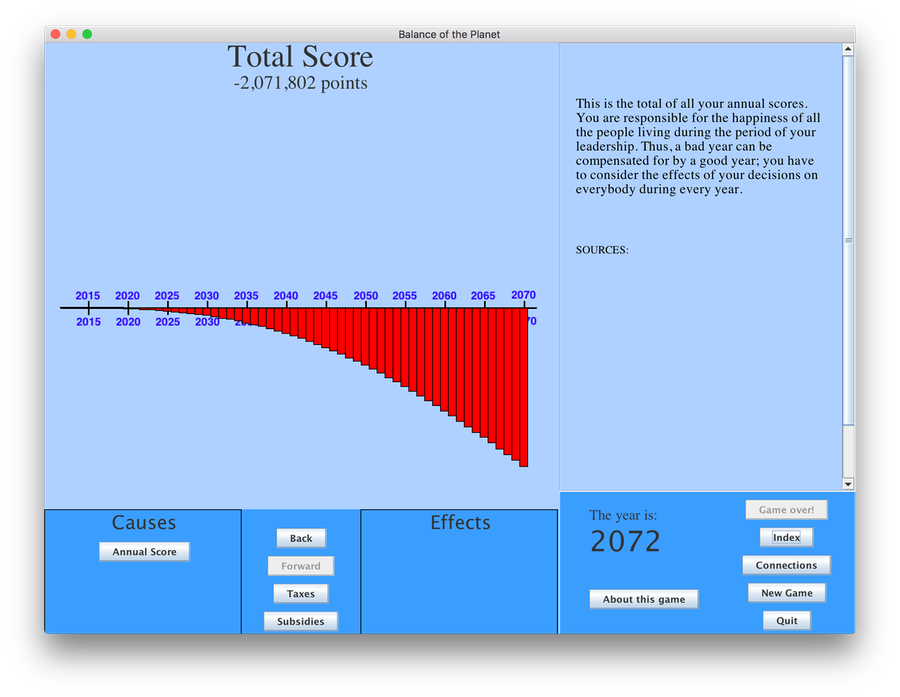
This is a history page. It shows the value of a factor, in this case, the player’s total score. The player can step backwards through the Causes to see why the score was so negative.
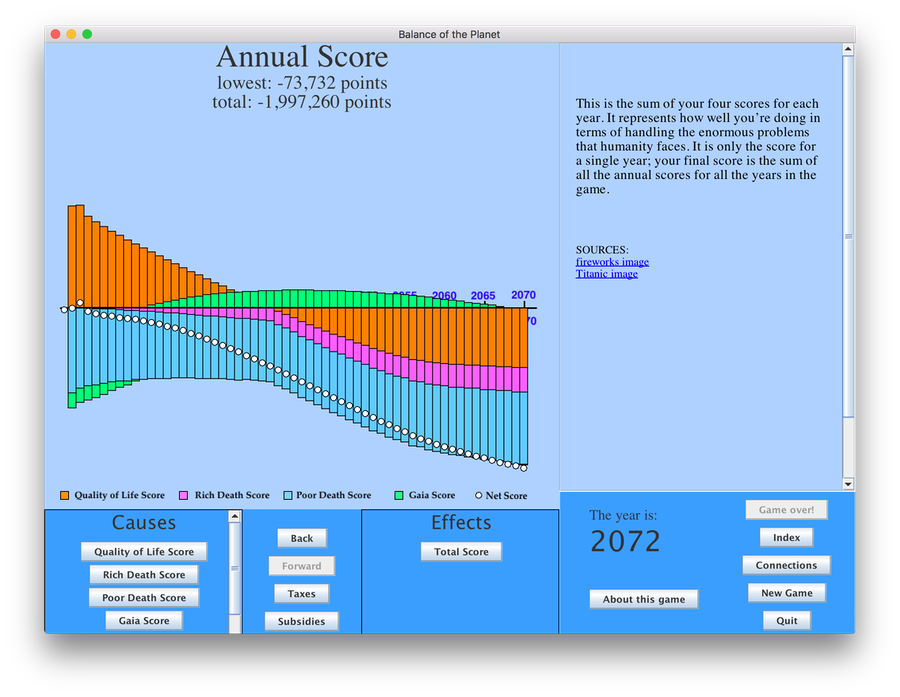
Look how complicated this bar graph is! It shows the four contributing factors to the Net Score. This is tricky code!
The player can see the history of each and every factor in order to figure out how things ended up the way they did.
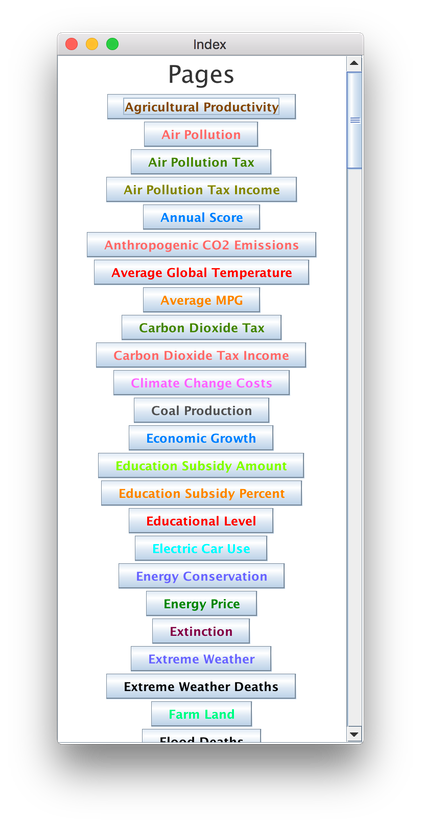
The player can see an index of all the factor pages and jump directly to one of them from here. Yes, each factor has its own color. Here’s why (the Connections Map):
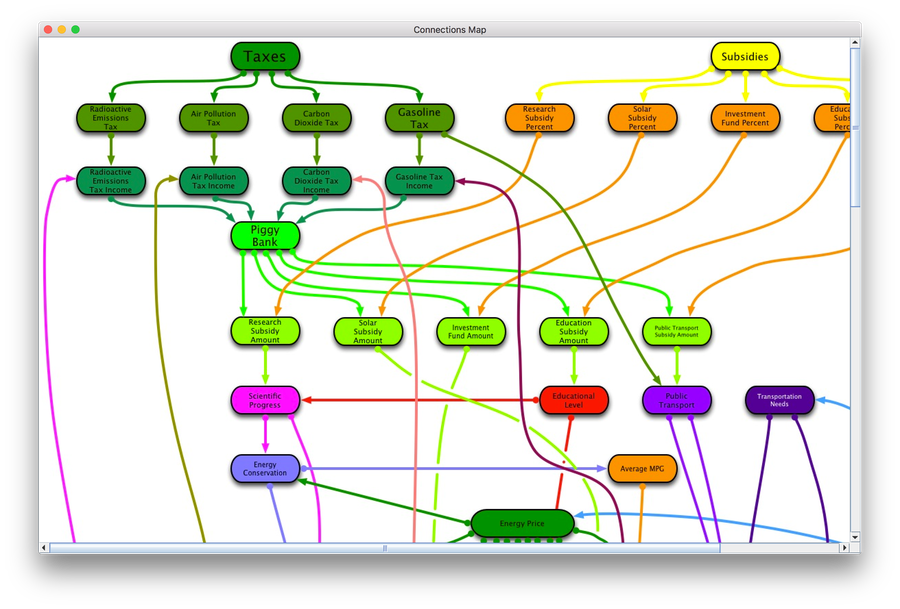
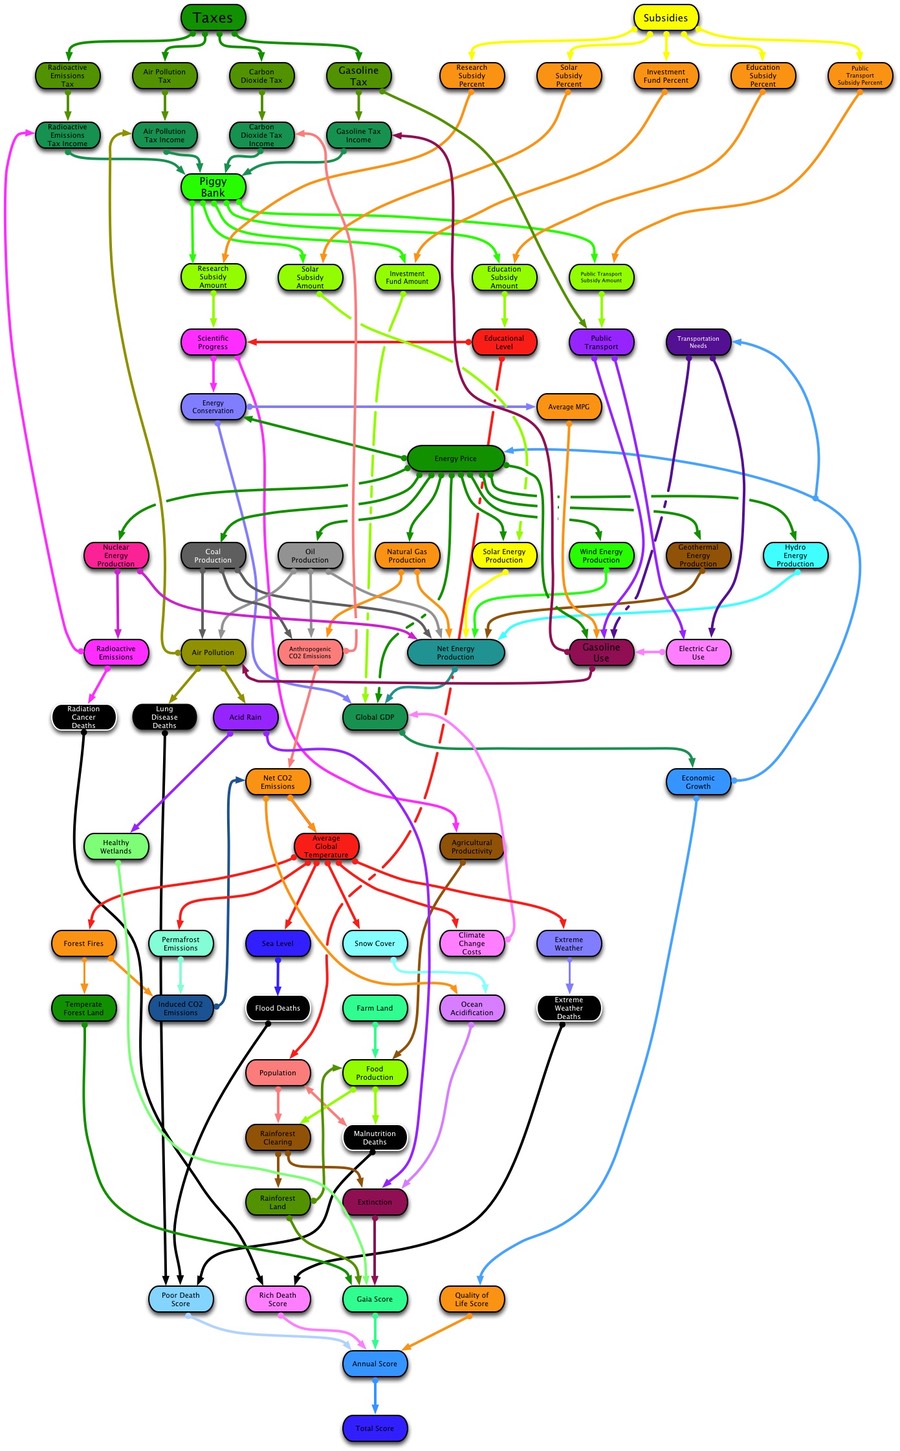
This is only the displayed version of the Connections Map. Here’s the whole thing:
The total package comes to under 4,000 lines of code. Here is a description of the files and their contents, in alphabetical order:
Bar 50 lines A tiny class used to represent the bars on the history bar charts.
CentralInput 120 lines All mouseclicks are processed by this class
ConnectionsMap. 40 lines Displays the connections map, a static jpg.
CoreStuff 370 lines Main locus of processing (the procedure “main” is in Globals.java)
FormatStuff 40 lines formats numbers for display
Formula 150 lines no longer used; handled a feature I dumped
Globals 160 lines contains main method. declares global variables. No getters!
History 190 lines displays the historical changes of a major variable in a bar chart
Model 810 lines the math for each page. You just copy and paste this stuff
MultiScrollBar 230 lines. a unique user input device I created. Might be tricky in JavaScript
Page 250 lines displays the page for each variable
SplashDemo 100 lines not in use
SwingHistory. 450 lines displays the history bar charts using Swing
SwingStuff 730 lines Java Swing display module. Yuck
UserData 50 lines used for saving the game. No longer needed
UserLevel 110 lines allows the user to declare one of three difficulty levels
WriteHTML 220 lines. writes an HTML version of the page
We’ll probably want to re-arrange this structure to make it more rational. I’ll also have to update the numbers to current figures — the game is set to run from 2013 to 2072. I’m tempted to add a feature that permits the player to see how it would play if we started working on climate change in earlier years.
This will be a big commitment on your part; it took me 16 months to create. I think that I could pull it off in perhaps four months, but I already understand the code. You should figure at least six months, probably longer. This may require a team effort.