Back to the Energy Price problem described in the previous essay. I am sticking with the simple equation expressed in this graph:
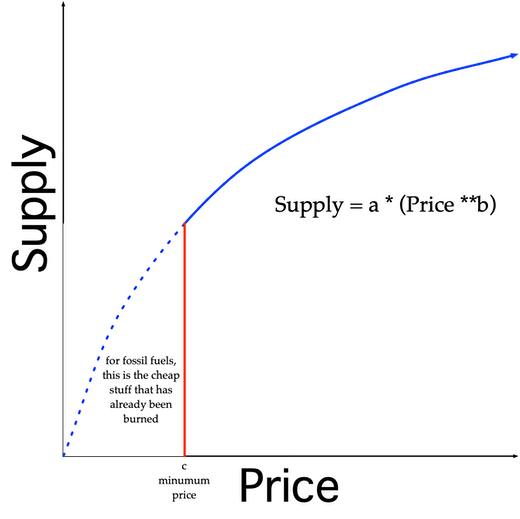
This is what the terms mean:
a is a measure of the overall size of the supply. a for coal is bigger than a for oil.
b is always less than 1. If b were equal to one, then the blue curve would be a straight line heading upward. The smaller b is, the more rapidly the blue curve flattens.
c applies only to nonrenewable resources: fossil fuels. It represents what has already been burnt up. For everything else, c = 0.
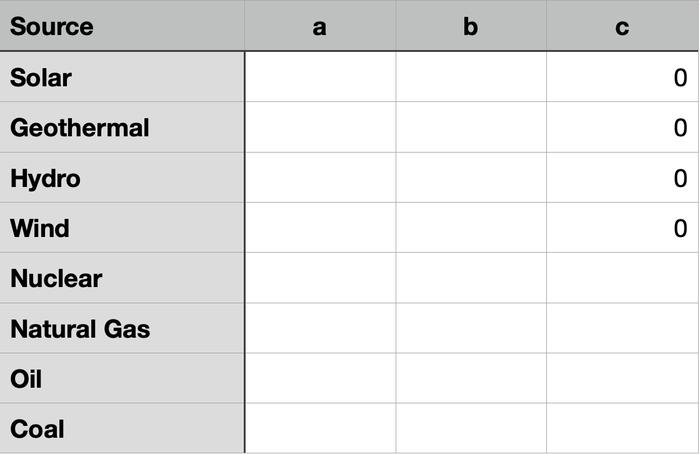
I have eight energy sources:
Solar
Geothermal
Hydro
Wind
Nuclear
Natural Gas
Oil
Coal
I need to fill in this table: