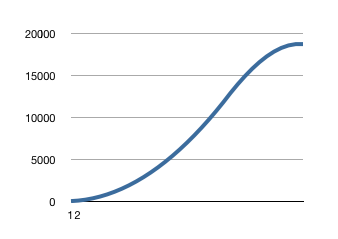
I’ve wasted days trying to come up with a nice S-curve to reflect the supply elasticity of price for renewable resources. Nonrenewables should have a logarithmic relationship, such as I discussed on December 26th. However, renewables don’t work that way. Their supply elasticity curves should trace an S-shape, like this:

I tried all sorts of snazzy functions to get this working right, in a manner that could readily be shaped and tuned with just a few obvious coefficients – and I never could come up with something that seemed right.
Until I took a different tack. Instead of thinking in direct terms of the final shape, I came at it from the side: what kind of function would produce this curve if it were integrated or differentiated? In other words, what would the integral of the area under this curve look like? What would a graph of the slope of this curve look like?
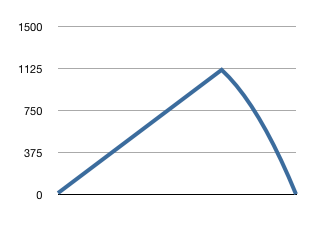
That’s where I hit pay dirt, because the graph of the slope of this curve looks like this:

(Please ignore the fact that the descending leg isn’t straight – I’ll explain that in the next paragraph.). Just think of this as a simple linear ramp up followed by a linear ramp down. This simple function yields the beautiful S-curve above. Isn’t that sweet?
There were, however, some additional considerations that had to be factored in. First, I wanted an S-curve that would flatted out at the top. In other words, the slope had to go to zero at the end. It turned out that, the way I carried out the calculation, it was a little easier to do it with the slightly curved downward ramp than with a truly linear downward ramp.
The more important consideration was coming up with the coefficients that controlled the shape of the curve. Those were:
1. The slope of the rising segment, which was easy enough: I just called it the growth rate.
2. the position of the peak. This turned out to be trickier than it looks. I set the coefficient by the price at which I wanted the peak (which corresponds to the inflection point on the S-curve). However, this proved computationally clumsy, so for the computations, I translate that critical price to the height of the highest point in the ramp.
3. The “startup price” at which the renewable first generates some supply. You can’t get any solar electricity until you’ve spent at least, say, $3 for the first kW-hr. This startup price is crucial to differentiating the curves.
Thus, I needed just three coefficients to get almost any shape S-curve I desired. I set up a spreadsheet and tried lots of different coefficients until I had exactly the curves I wanted for each renewable energy source. Then I wrote the code to implement this calculation. It was somewhat different from the code used in the spreadsheet, because the numerical integration had to be handled a bit differently, given the computational context. I expected that it would take me a day or two to get everything tuned properly. But, wonder of wonders, the code worked well on the first try! Its output was very close to what I wanted. A half-hour’s fine tuning yielded excellent curves.
It looks as if I’ll be OK for the January 1st deadline.
