Mean Flare Counts
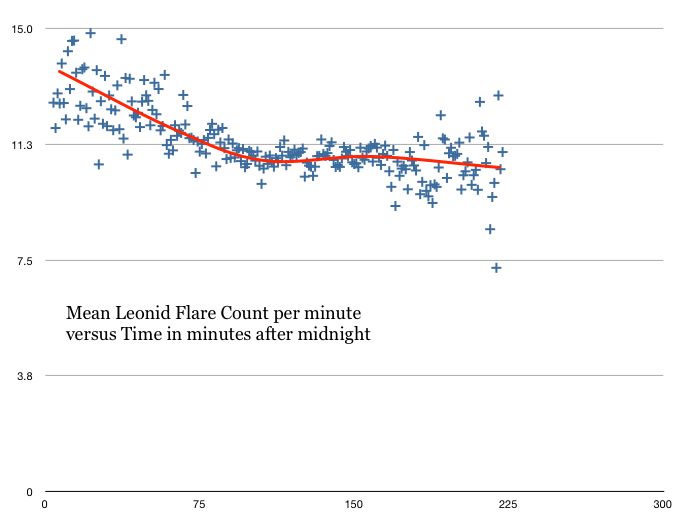
As the night progressed, did the Leonids themselves change? One way to answer this question is to look at the average flare count of Leonids through the course of the night. The flare count is really just a measure of how long the Leonid was visible. Presumably, bigger Leonids last longer than smaller Leonids, so the average flare count for each minute, measured through the four-hour duration of the outburst, might change. Here’s the graph:

Golly gee whillikers, there is a change! Theory suggests that there should be a difference, with larger Leonids at the ends and smaller Leonids at the center. This graph only halfway conforms to theory. After the peak, there appears to be no change in the size of the Leonids. There is a great deal more vertical spread towards the edges; that’s because there are fewer Leonids in each minute, so we get more numerical noise.
All in all, this is not one of the more revealing results of the dataset. It is rather interesting that the theoretical expectation is violated by this data, but I don’t know what to do about that.
